Have you started tracking your Carbon Footprint? My Spin on Carbon Offsets
Ever since COVID-19 started, I’ve been curious about how staying at home more would affect our Carbon Footprint and Carbon Offsets. We started social distancing mid-March, which means that we now have had several months worth of data to review. The first half of this year gives us a large enough sample size to see if any trends are emerging, though I’m not sure that we will have a clear picture for quite some time. First, I’d like to give a synopsis of what life was like over this six month period. I think that most of us are experiencing similar lifestyle changes but a quick review is good for context:
- Jan & Feb – Life was normal. Most days, Kellie and I both commuted to work. Most weekends, we got together with friends/family and did something outside of the house.
- March – The first half of March was like Jan/Feb, while the second half of March was like April/May.
- April & May – We were self-quarantined. Kellie works at an essential business, so her commute was unchanged during this period. I was lucky enough to be able to work from home. Outside of Kellie’s commute, we only went out for food and other essential trips.
- June – We were still trying to stay socially distant though we did venture out of the house more. I started going to the office for a few days/week. I’m still working from home 60-75% of the time, which is way more than pre-COVID when I was working from home 15-25% of the time. We also had two renovation projects at the house, including an Energy Efficiency Retrofit that I will be talking about more in my next post.
My Original 2020 Carbon Offsets Projection
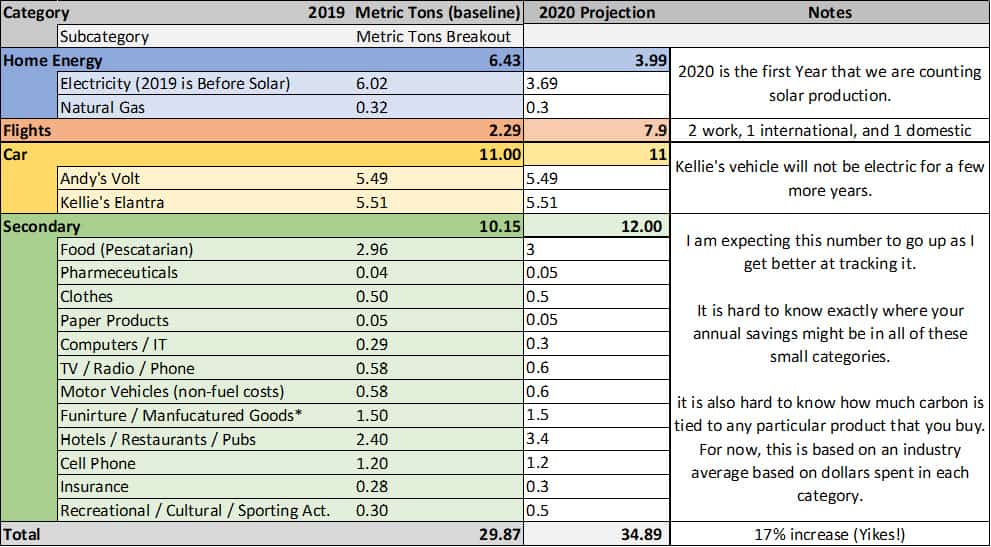
I never published my projection for 2020, but I originally thought that we would see some savings from solar and a (yet to be determined) home energy project. Then we would “wait and see” how that home energy project-affected our home energy usage and adjust our strategy from there. Keep in mind that back in January I did not know that the home energy project would end up being insulation and air sealing. I’ve included my Baseline Carbon Emissions calculation with my original 2020 projection below. Despite some reduction in Home Energy usage, we were expecting to increase our footprint in 2020 as a result of an international trip that we had planned. This trip actually inspired “Post #4: How to Calculate Air Travel” because I was taken aback that the flight itself was going to add ~20% to our footprint.

My Updated, Mid-Year, COVID Adjustment Carbon Offsets Projection
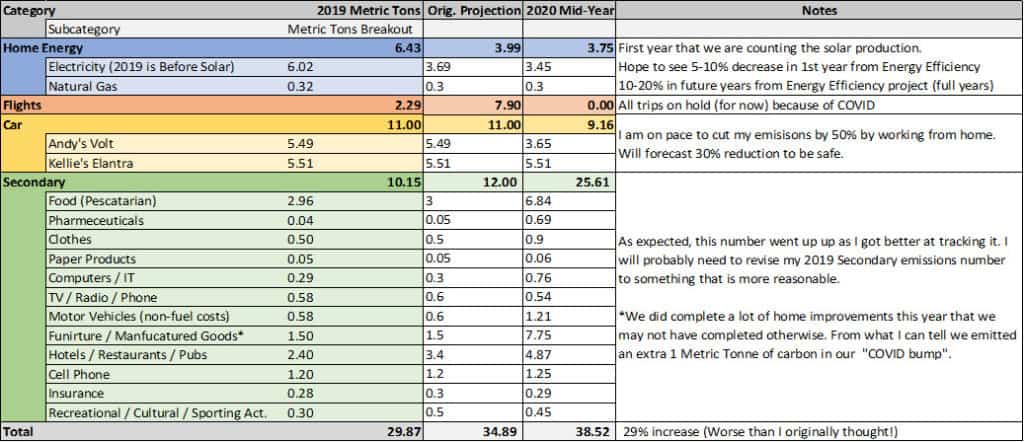
To state the obvious: A lot has changed in 6 months. The chart below shows our 2019 baseline emissions, our original 2020 projection, and adds our updated Mid-year, COVID adjusted projection for 2020. The methodology for my updated projection is pretty straight forward: I took the actual numbers from the first half of 2020 and doubled them to get a full-year projection. There are a few exceptions where I toned down the second half projection, but for the most part, I kept it simple. I also isolated a few things that I attribute specifically to COVID. These items are grouped together in what I am calling the “COVID bump”, and I will get to those in more detail in a bit.

Now I am going to break down some of the interesting developments:
- Home Energy Usage is trending in the right direction! We’ve added insulation and envelope sealing and I expect to see 5-10% savings from the 2nd half of the year. Next month we will take a look at my July energy usage, to see how it compares to previous years. July will be the first full month of having energy efficiency.
- Flights are now zero! Like many of you, we are not flying now. As I’ve expressed in previous posts, I’m concerned about our ability to maintain a low flight footprint. For now, we will take the win because we’ve got some serious issues further down the chart.
- Car emissions are down as well. Between me and Kellie, my commute is the only one that has changed and it has resulted in almost 2 metric tonnes of carbon being saved. Furthermore, now that my trips are shorter they are more likely to be all-electric. So the little travel that I am making is more efficient than in previous years. This is very encouraging.
- Secondary emissions are my new Achilles’ Heel. “Knowledge is Power”, but it is also a huge pain in the butt because I really miscalculated how much we spend. My hypothesis is that most of the increase here is due to more accurate accounting and therefore is not truly an increase. However, there should be some emissions here that are due to COVID and my household purchasing more things online. This category deserves a closer look.
Zooming in on Secondary Emissions
If we assume that our baseline Secondary Emissions were actually 25 Metric Tonnes of Carbon (instead of 10.15 Tonnes), then we are on pace to reduce our emissions by 15%. This is pretty good and gets us over halfway towards our goal of 26% reduction by 2025. Nonetheless, I dug through the numbers a bit more and was able to attribute about 1 Tonne of Carbon specifically to my increased spending due to COVID 19. I started to call this increase in emissions the “COVID Bump”.
The COVID Bump is simple enough in concept: it consists of all of the things that you are buying now that you would not have purchased in a world without COVID. The best example is the face mask. Let me be clear, I am not calling face masks bad. I am simply pointing out that I would not have spent money on face masks had the COVID pandemic never occurred. Here are some other examples:
- Above ground swimming pool (we didn’t get one, but I’ve seen a lot more of them since everyone is stuck at home)
- New home entertainment purchases, such as a Playstation or Xbox
- Home Improvements that would not have otherwise done but you are “stuck at home, so the place might as well be nice”. For us, this took place in the back yard where we now spend a lot more time than we did before.
For the most part, this is pretty easy to figure out. Again, items like these added ~1 Metric Tonne of carbon emissions to our household.
But what about the things that you used to buy at the store, but you now ship to your house? There is a marginal increase in the emissions from these items due to the additional shipping. I don’t have the magic formula here, but I know that this is something that is going to be studied and reported on as we get more information. While we are one pace to save ~2 tonnes of carbon emissions by working from home instead of commuting, we have also added ~1 tonne of direct emissions plus some unknown amount of indirect emissions due to COVID. At this point in the year, it looks like my “COVID Bump” will be enough to greatly reduce my COVID emissions savings due to driving less. Not the news that I wanted to hear, but a good data point to have. I’m interested to see how the rest of the year shakes out. Stay tuned.
If you are keeping track of your emissions and carbon offsets or if you have a good COVID Bump story, I’d love to hear from you!
— Andy
Share your carbon footprint journey on social media. Tag us on Facebook https://www.facebook.com/goodenergysolutions and hashtag #CarbonFootprint.
Read Part Seven in the Tracking Your Carbon Footprint Series

