
Across the United States, commercial and industrial (C&I) electricity customers are confronting a stark reality: traditional utility costs are climbing, and the trend shows no signs of reversing. For business leaders focused on operational resilience and margin protection, this isn’t just a cost issue. It’s a strategic inflection point.
The National Context: Rates Up, Predictability Down
Electricity price inflation is not uniform, but the trajectory is unmistakable:
-
Wholesale energy costs have risen due to higher fuel prices (natural gas and coal) and constrained supply.
-
Grid reliability investments, driven by aging infrastructure and weather resilience needs, are being passed through to ratepayers.
-
Policy-driven cost allocations for renewables and transmission upgrades are increasingly embedded in utility rate designs.
For C&I customers, this translates into higher baseline demand charges, escalating peak usage costs, and greater exposure to volatile market pricing. The result: less predictability for budgeting and greater risk for energy-intensive operations.
Kansas & Missouri: A Closer Look at Regional Dynamics
Over the past 20-25 years in Missouri and Kansas, commercial and industrial electricity rates have generally trended upward, reflecting broader national patterns of rising energy costs due to generation, infrastructure, and regulatory pressures.
Kansas
According to a detailed 20-year historical analysis (based on U.S. Energy Information Administration data):
-
In 2001, the commercial electricity rate in Kansas was approximately $0.062 per kWh.
-
By 2020, that rate had climbed to about $0.104 per kWh.
-
Over those two decades, the commercial electricity rate increased ~67.7% (an average annual increase of ~2.6%).
This means a Kansas business paying ~6.2¢/kWh in 2001 was paying ~10.4¢/kWh in 2020, a significant increase over 20 years.
Industrial rates in Kansas followed a similar upward pattern:
-
~4.6¢/kWh in 2001 → ~7.3¢/kWh in 2020 (~60% increase).
| 2001 Rate | 2020 Rate | Average Annual Increase | Total Increase | Predicted 2040 Rate | |
| Industrial | $0.046 | $0.073 | 2.4% | 60.4% | $0.117 |
| Commercial | $0.062 | $0.104 | 2.6% | 67.7% | $0.174 |
In Kansas, utilities like Evergy are navigating multiple cost pressures:
-
Infrastructure upgrades across urban and rural networks.
-
A shift in generation mix and associated transition costs.
-
Regulatory proceedings that have historically leaned toward cost recovery through rate design rather than efficiency incentives.
The outcome is a noticeable upward trend in average C&I utility rates. This trend has many businesses being negatively impacted by rising monthly energy bills and more dificult budgeting cycles.
Missouri
Missouri’s C&I sectors face similar headwinds:
-
Higher pricing tiers during peak demand periods.
-
Transmission and distribution (T&D) cost pass-throughs.
-
Incremental charges tied to grid modernization and renewable integration.
While granular rate structures vary between utilities such as Ameren Missouri and Evergy’s service territory, the macro impact is the same: rate volatility and growth that erode operating margins.
Short-Term Acceleration (2018-2025)
Recent analyses indicate that:
-
From 2020 to 2023, overall electricity rates in Missouri increased about 20%.
-
In 2025, utilities such as Ameren Missouri received regulatory approval for additional rate increases (~12%) to cover infrastructure and grid operations.
| 2001 Rate | 2020 Rate | Average Annual Increase | Total Increase | Predicted 2040 Rate | |
| Industrial | $0.044 | $0.068 | 2.2% | 55.8% | $0.107 |
| Commercial | $0.059 | $0.089 | 2.1% | 51.6% | $0.135 |
This recent acceleration underscores how utility cost pressures, like infrastructure upgrades, generation costs, and regulatory approvals, continue pushing rates higher.
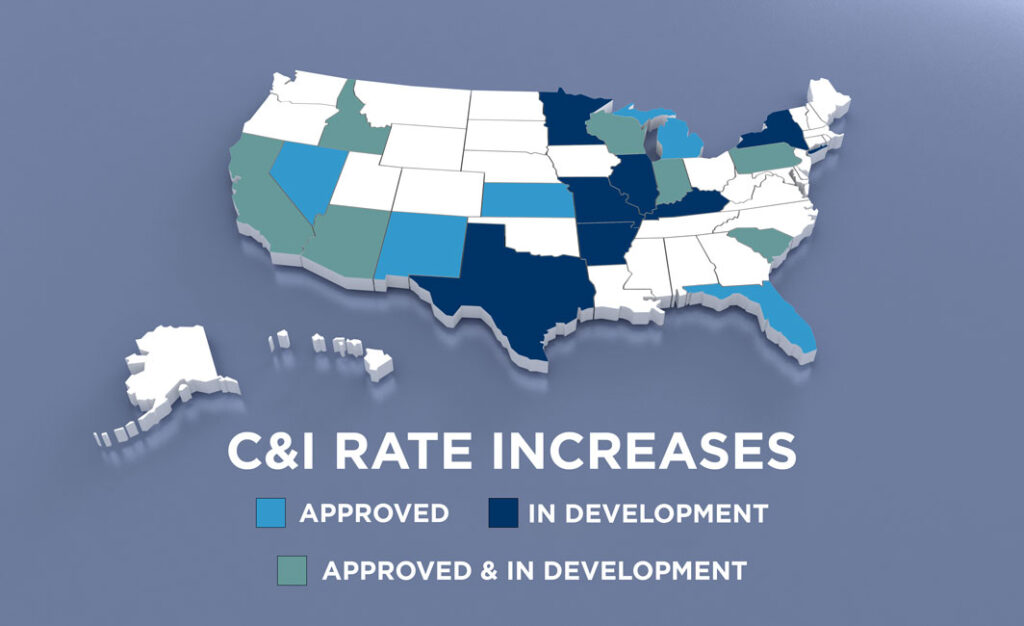
C&I Rising Utility Rates Across the Nation
Here’s a breakdown of some of the rate increases that have taken place in several states.
Arizona
- APS: Proposed 6.5-30% increase
- TEP: Proposed 10-13% increase
- Trico: 9.26% increase January 2026
- SSVEC: Proposed ~14% increase
California
- SDG&E C&I customers saw rates increase 10-11% January 2026
Florida
- FPL C&I customers will see increases of ~2-3% depending on class and usage
Idaho
- Idaho Power: Proposed 17% increase for small C&I, 7% for large C&I by January 2026
- Avista: ~10% increase took effect September 2025
Indiana
- NIPSCO C&I rates increased 9-14.6% in July 2025
Nevada
- NV Energy C&I customers saw bill increases between 3-22%, depending on customer class and usage in October 2025
New Mexico
- TXNM C&I customers saw 6.95-9.75% rate increases depending on class and usage in July 2025
New York
- NYSEG: Proposed 11% increase in May 2026
- ConEd: 2.8% annual increase across all customer classes over the next three years
Pennsylvania
- PPL: Proposed increases up to 62% depending on customer class and size
- PECO: ~13% increase for the average C&I user took effect June 2025
Texas
- El Paso Electric has proposed to increase small C&I rates 3-25%, depending on usage
Solar Is a Financial Hedge
When utility rates rise faster than inflation, the arithmetic of energy procurement shifts. Solar becomes not just “a good idea,” but a strategic financial decision:
1. Fixed Energy Costs vs. Variable Utility Bills
Solar power systems provide a predictable generation profile:
-
Lock in energy costs for 20+ years.
-
Reduce exposure to external market pricing.
-
Improve forecasting accuracy for finance teams.
2. Reducing Peak Demand Exposure
For many C&I customers, demand charges, fees based on maximum power use during a billing cycle, are some of the largest components of the bill. Solar:
-
Lowers net peak demand.
-
Smooths load profiles.
-
Reduces peak-related cost spikes.
3. Capitalizing on Federal Incentives
-
30% Federal Commercial ITC still exists, but only for projects that meet accelerated deadlines.
-
Projects must begin construction by July 4, 2026 or be fully operational by Dec. 31, 2027 to qualify for the tax credit.
-
Projects that miss these deadlines won’t qualify for any federal solar ITC at all.
These factors can compress the payback period and enhance long-term returns on solar investments.
Why Now? Timing Matters
Three market shifts make 2026–2027 particularly pivotal:
-
Utility rate projections suggest continued escalation.
-
Tax incentives (especially federal) will phase down.
-
Interest rates and financing structures are becoming more favorable for capital projects.
Businesses that delay are effectively locking in higher energy costs and exposing themselves to missed savings.
Case in Point: Midwestern Business Savings
Consider two hypothetical C&I clients:
| Metric | Business A (No Solar) | Business B (Solar) |
|---|---|---|
| 2026 Utility Cost Projection | ↑ 6–8% YOY | Offset by solar generation |
| Net Energy Spend (5 Years) | Volatile & rising | Stable & predictable |
| Demand Charge Exposure | High | Reduced |
| ROI on Energy Spend | Negative | Positive (IRR 15%+) |
The comparative math isn’t subtle. It’s compelling.
Conclusion: Solar Is No Longer Optional. It’s Strategic Insurance
Rising C&I utility rates are squeezing business budgets nationwide, but nowhere is this more actionable than in Kansas and Missouri. The combination of rate pressure, investment incentives, and long-term operational stability makes solar a necessary part of prudent energy planning.
For businesses serious about protecting margins, stabilizing costs, and future-proofing operations, solar shifts from a sustainability checkbox to a cornerstone of financial strategy.
SEE IF YOUR HOME OR BUSINESS IS A GOOD MATCH FOR SOLAR
GET A FREE QUOTE
 Our mission at Good Energy Solutions is to provide our customers with honest, real solutions to reduce their fossil fuel consumption and lower their long term energy costs. Our combination of hands-on experience, education, and outstanding customer service make our company the clear choice to help you achieve your energy goals.
Founded in 2007 by Kevin and Shana Good, Good Energy Solutions has earned a reputation for our expert reliable service, long workmanship warranties, and quality commercial and residential solar installations.
We are engineers and craftsmen designing for efficiency while keeping aesthetics and longevity in mind. Because of our installation quality and customer service, Good Energy Solutions' solar panel systems feature some of the longest product and service warranties in Kansas and Missouri. Also, we have more NABCEP® Certified Solar Professionals on staff than any other company in Kansas or Missouri. To achieve this certification, PV installers must demonstrate that they possess extensive solar PV installation experience, have received advanced training, and passed the rigorous NABCEP certification exam.
If you would like to know more about solar power for your home or business, contact us here.